By Patricio Gallardo and Daniel McKenzie
After reading several stories on the Wish Dish, we took a peek under the hood of the WishDish to see what motifs are running through the stories, to help contributors find their tribe. Our hypothesis was that the WishDish stories would fit into just a few categories such as Sport, Faith or Relationships, and that these categories could be identified by the vocabulary used in the stories. By analysing what makes two stories similar, we would be able to provide better recommendations to readers, based on what they’ve already read. Using a bit of Math, Computer Science and common sense, we obtained some interesting insights into the WishDish community.
First the technical stuff. Once we received the set of all stories from Bryan, we used the Python programming language and the Pandas library of functions to prepare the data for our analysis. Specifically, this meant placing the data into a structure called a data-frame, which is not too dissimilar from a table, or an excel spreadsheet. We’ve included a screenshot of the data-frame below, and you can see that we’ve kept, for each story, the author name, a unique author ID, the date the story was uploaded, and the raw (that is, unprocessed) text of the story. Single story ids index the rows.

In the column ‘CleanStory’ we store a pre-processed version of the story. Specifically, we used the Natural Language ToolKit (NLTK) to change all letters to lowercase, remove punctuation and remove ‘stop words’ (frequently occurring words that are grammatically useful, but do not carry much meaning such as ‘a’ and ‘at’).
With our data clean, we were ready to do some analysis. First, we needed to build a ‘dictionary’ of words to be used to distinguish our stories. Words which occur in most stories are no good, and neither are words which occur only in one or two stories. Fortunately, the SciKitLearn toolbox has a function, TfidfVectorizer, which automatically builds this dictionary. If we do not impose any limit on the size of our dictionary, then it will have 173774 words in it! With a bit of tweaking, we arrived at a set of 500 words and bigrams (common two word phrases like ‘red wine’ or ‘high school’) characteristic to the WishDish that would be most useful in figuring out what a story is really about. For example, “believe”,”athlete”, “beauty”, “cancer”,”change”,”college”,”my parent”, “love”, “believe”, “depress”, “father”, “my mom”, “future” were all in this set. We then used the SciKitLearn toolbox to count the number of times each word occurred in each story, and saved the results in a data-frame, visible below.

Using these wordcounts, we can determine how close two stories are to each other. Loosely, if two stories have similar wordcounts, they are deemed close. Below is a data frame containing the distances between all stories. Obviously, the distance from a story to itself is zero!

We were now able to build a Recommendation engine for the WishDish! Essentially, given any story in our database, identified by its StoryID, our engine returns the three closest stories to it.

Moreover, we were able to group the stories based on the nature of their content. Using a simple algorithm called K-means, we sorted the stories into seven groups or ‘clusters.’ The sizes of those groups are 31, 51, 48, 18,73 110 and 166 respectively. The most common words in each cluster (technically, the most common words in the cluster centroid) tell an interesting story. For example, the words associated most strongly with cluster two include: college, family, Georgia, great, high, high school, level, life, people, school, sports, students, success, team, time, uga, wanted, work, etc. A closer look reveals that the stories contained in this cluster include many of the ones related to sports. On the other hand, the words most associated with cluster seven include: “cancer, change, college, dad, day, eyes, face, family, feel, finally, heart, help, home, hope, kids, lives, love, mom, parents, remember, summer, time. A closer look reveals that this is a collection of stories about dealing with loss and illness in the family.
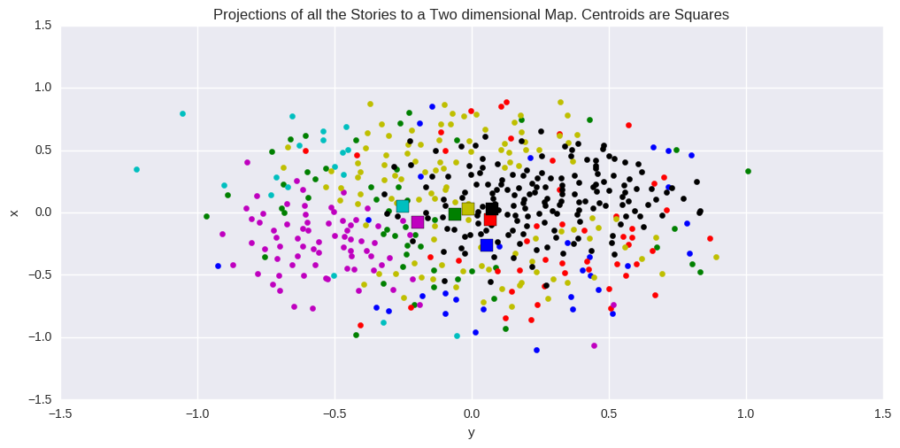
At this point, we decided to look at the shapes and boundaries of our clusters. What we found surprised us. As it turns out, the groups kind of flow into each other, without any hard borders between them. It isn’t easy to visualize such a large data set; recall that we are talking about hundreds of stories with 500 different keywords! However, the picture below, a projection of the dataset into two dimensions, illustrates this lack of borders quite clearly.

What was going on here? After scratching our heads for a while, the answer became apparent. Stories are rarely about only one thing. A story about a toxic relationship might equally belong to the Relationship cluster or the Health cluster. Likewise, a story about an athlete finding the strength to keep competing could be either Sports or Motivational. This phenomenon leads us to reconsider how we viewed the WishDish stories, and their authors. Instead of separate tribes, WishDish contributors could be better thought of as residing in loosely defined neighborhoods of a large city. As further evidence of this, it is evident from the histogram below that most stories are more or less the same distance from any other story. So WishDishers, get exploring! Be sure to examine your own ‘neighbourhood’ closely, but don’t be afraid to follow a trail of stories into a new neighborhood; you might find them more relevant than you think.


